Savings and Investments thread
Comments
-
Because the traditional measures of inflation are rubbish at assessing the value of pay over time. They were designed for calculating the time value of money and opportunity cost of an investment. Usually a public investment.Jints said:
How does this fit with the second bullet point i.e. that £6,000 in 1980 if adjusted for inflation would be equivalent to £19,000 in 2023?cantersaddick said:No. Have a look at the screenshot. I'm not looking at the housing bit I'm looking at- Equivalent income today. To have the same buying power (housing is just one element) as someone earning £6000 in 1980, one would need to earn £76,210 today.
Buying power/purchasing power. The same thing. And takes into account interest rates too. Its a much better method of comparing pay over time. This is accepted across economics. It's literally my career to know these things. The difference between the 76k and 85k in my model is likely due to the starting point used (I need to check mine) and the bespoke-ness of my model to the issue its focused on.
Inflation=/= purchasing power.1 -
Good point. In which case its doing something different to my model.Huskaris said:That is only looking at the house price comparison, not inflation as a whole.
It quotes house prices as being up 1170% vs 1980s
6,000x12.7=76,200. It's only looking at the housing element...0 -
Wow, taking this away from Canters as he's an Economist and it's literally his job to know these things.
That source above, I replicated what Canters had in Google, and the source on the AI overview is literally just some idiot on LinkedIn. I hope he's not an economist!
My degree was Investment and Financial Risk Management, which focused largely on econometrics and quantitative methods, but also had a fair bit of economics attached, if that's relevant.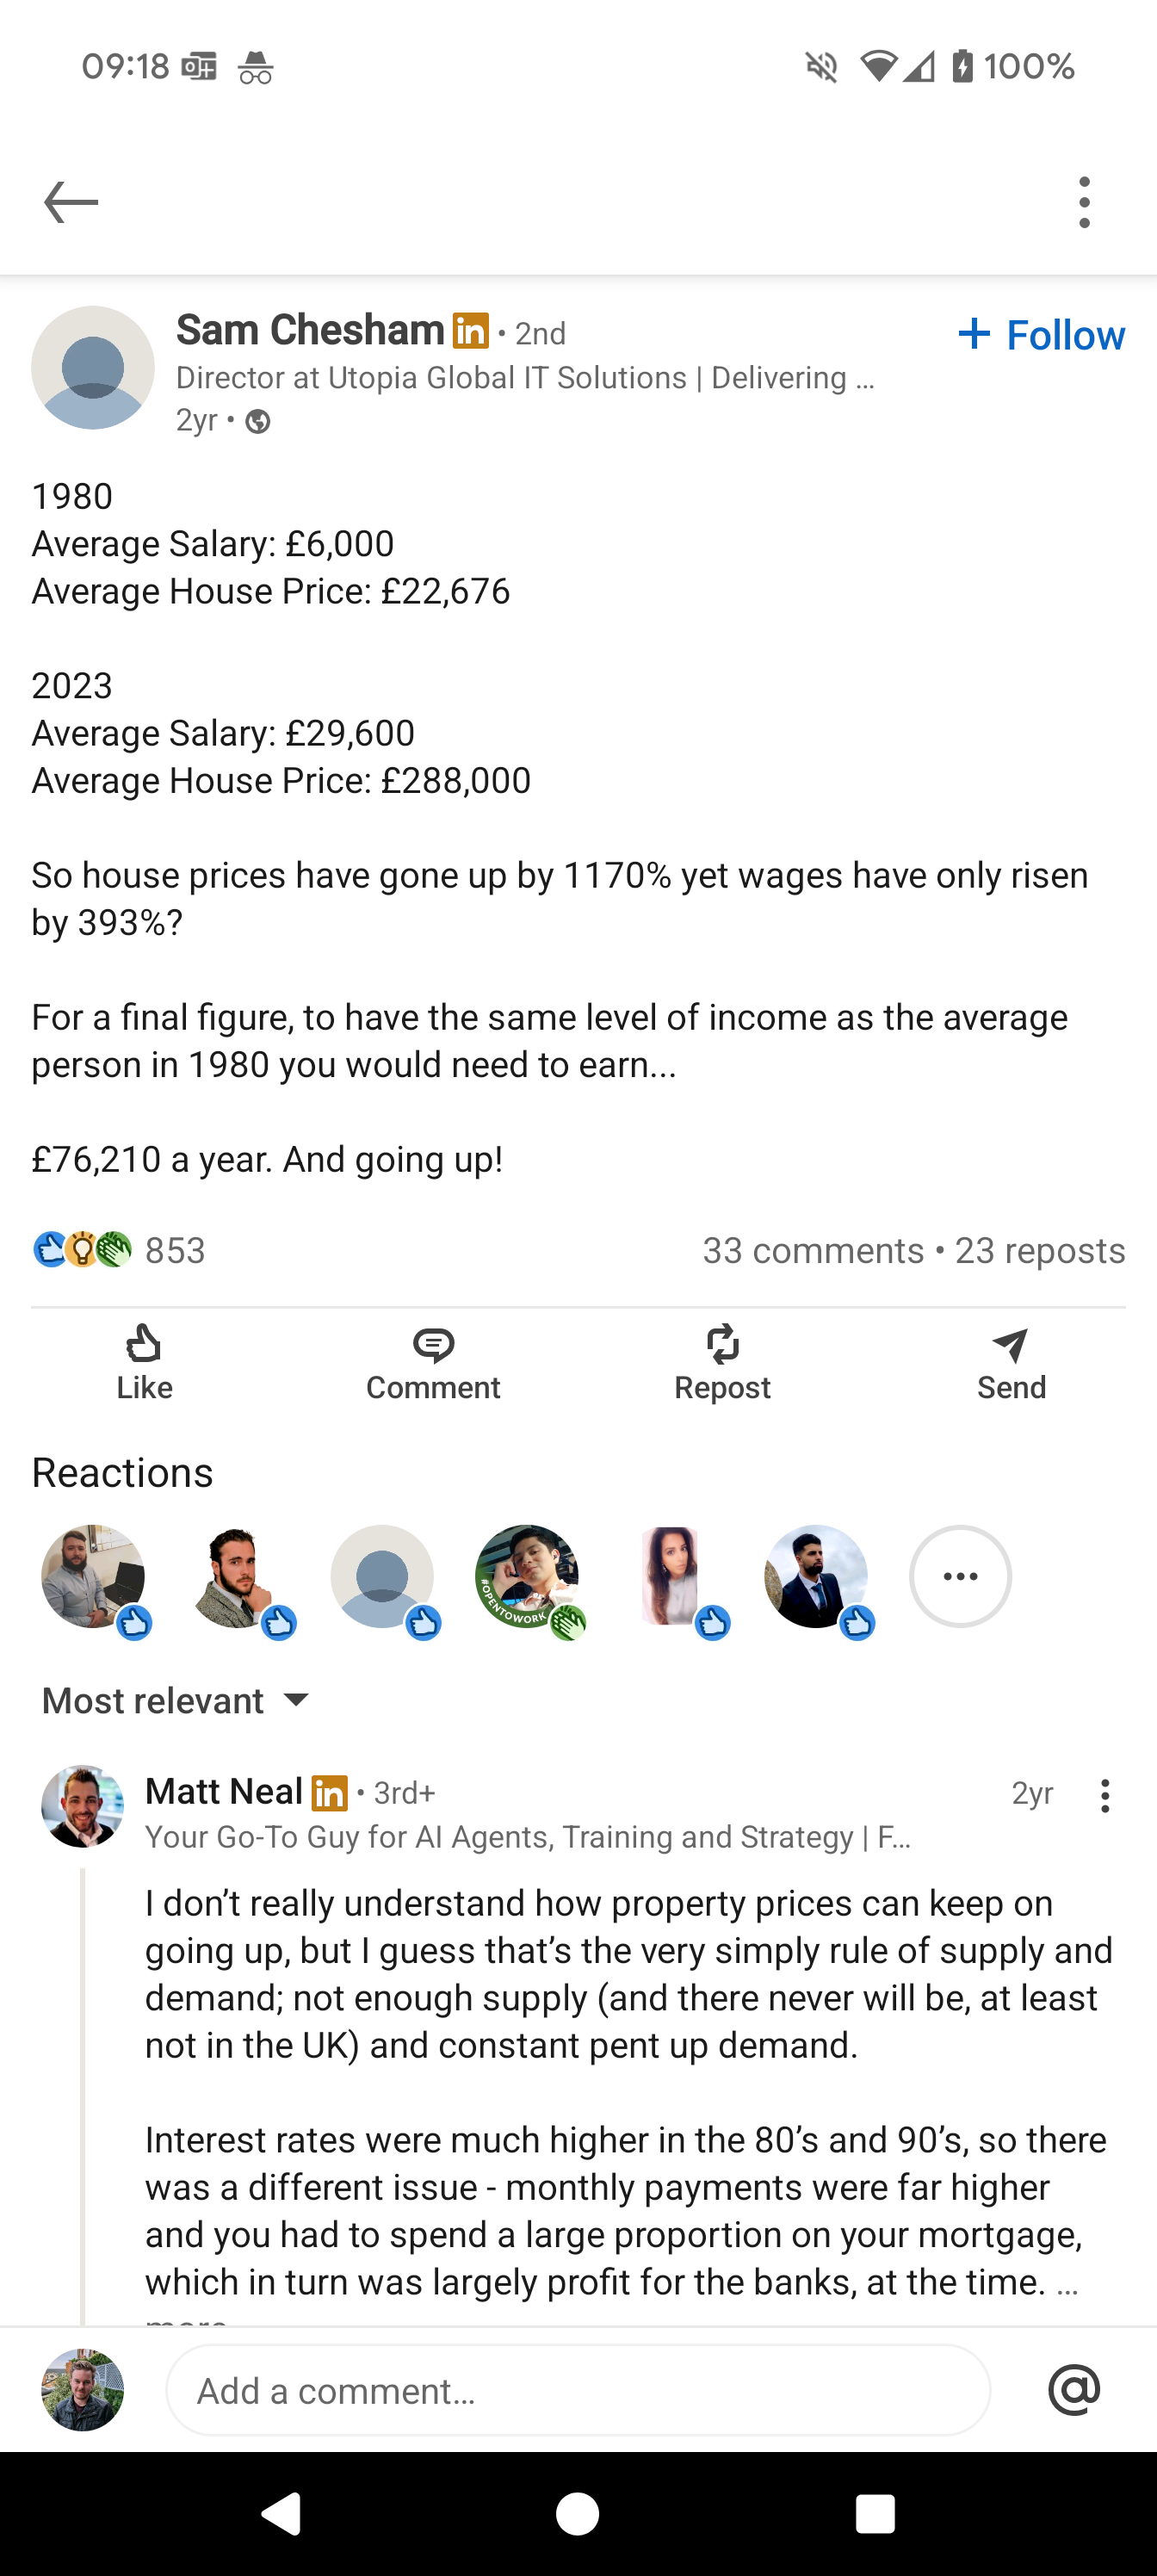 3
3 -
Yeah, not your fault that is just a very poor AI overview, as referenced above, that's really poor on Google's part.cantersaddick said:
Good point. In which case its doing something different to my model.Huskaris said:That is only looking at the house price comparison, not inflation as a whole.
It quotes house prices as being up 1170% vs 1980s
6,000x12.7=76,200. It's only looking at the housing element...1 -
Yeah fair. I did only use that as my train is delayed and I couldn't get to my actual model. It looked similar ballpark so I believed it.Huskaris said:
Yeah, not your fault that is just a very poor AI overview, as referenced above, that's really poor on Google's part.cantersaddick said:
Good point. In which case its doing something different to my model.Huskaris said:That is only looking at the house price comparison, not inflation as a whole.
It quotes house prices as being up 1170% vs 1980s
6,000x12.7=76,200. It's only looking at the housing element...3 -
golfaddick said:
There has been a spike in inflation this year partly driven by the train drivers & doctors getting big pay rises as soon as Labour came in last July.Carter said:
I don't think that argument about low paid workers being paid an actual living wage causing inflation is without merit. What it means in reality though is some people will pull in a bit less money but a lot of people all of a sudden might have some more to spend on stuff that stimulates economies, holidays, cars, clothes, computers.cantersaddick said:
Which is what we are told will happen. But we've had ridiculous levels of inflation at the same time as wage suppression so many times in the last 50 years. The wage price spiral is a theory that gets wheeled out every time working people want higher wages but has literally never been bourne out in empirical evidence.golfaddick said:
Unfortunately that would lead to higher inflation, which would lead to higher interest rates, which would mean higher mortgage payments.....and for those that rent (which are a lot of the lower paid) will mean higher rents as landlords who have BTL mortgages increase the rent.Diebythesword said:
Sure, and the answer to that is to try and get them to a point where they are being paid more for what they do. That’s (provably, as it’s currently the case) not done by suppressing the wages of everyone else.hoof_it_up_to_benty said:
I think a lot of people would think it was a lot. There are plenty of people doing valuable jobs who get paid peanuts because society doesn't value their roles - they'd love to get a decent wage.Diebythesword said:
The point is it’s no longer a “privileged group”. £100k a year in London isn’t a lot. You can have highly specialised relatively junior roles popping into £100k territory. I want people to earn as much as they can so the tax man can take as much as they can without hurting productivity. The 65% tax trap doesn’t do either.hoof_it_up_to_benty said:
First World problem. Privileged group moaning about their lot and expecting sympathy.Huskaris said:First read about "Henry's" in a great article in The Economist, Standard have done a good article below. I find this area and this group of people fascinating.
https://www.standard.co.uk/lifestyle/henrys-high-earners-not-rich-yet-london-struggling-b1238642.html
If this is the biggest problem in your life you don't have too much to worry about.
No easy answer I'm afraid. Average income is around £32k pa so anyone affected by the reduction in the PA is earning 3x the average.
And it will get worse. Taxes need to rise. No idea where Rachel Reeves will go to next but I suspect it wont be from the low paid.
I'll say it again if average wages increased with purchasing power since 1980 it would be £85k. If the higher rate of income tax threshold had risen with inflation it would be £162k. We have a low pay problem in the UK.
It's not an arguement its fact.
That was an interesting juncture. Sterling fell immediately after those payouts and the governments borrowing costs rose. I don't think Reeves or the government have ever really recovered from that smack of fiscal reality.0 -
Excellent analysis of why a wealth tax simply wouldn’t work:
https://taxpolicy.org.uk/2025/07/22/uk-wealth-tax-anti-growth/
4 -
Good article, I always look at these things predominantly with what I know personally or have first hand experience in, I know people who own companies that would fall into this type of wealth tax. One (of many!) of the difficulties I have is 1. how do you value a private company? and 2. Just because someone has a company worth say £35m (however that is derived) doesn't mean the company has £500,000 PER ANNUM to pay a 2% tax above £10m.Diebythesword said:Excellent analysis of why a wealth tax simply wouldn’t work:
https://taxpolicy.org.uk/2025/07/22/uk-wealth-tax-anti-growth/
That's very different to say someone who has £35m of gold, that value per troy ounce is set and you could sell some to pay the 2%, you can't really sell a bit of a private company to pay a wealth tax.
I don't imagine a wealth tax will be introduced in this country in the short term, although it's not like in the past the government are against doing stupid things!Retirement in Cyprus is looking ever more appealing!1 -
As well as better weather you’d get better healthcare too from what our friends there tell us.Rob7Lee said:
Good article, I always look at these things predominantly with what I know personally or have first hand experience in, I know people who own companies that would fall into this type of wealth tax. One (of many!) of the difficulties I have is 1. how do you value a private company? and 2. Just because someone has a company worth say £35m (however that is derived) doesn't mean the company has £500,000 PER ANNUM to pay a 2% tax above £10m.Diebythesword said:Excellent analysis of why a wealth tax simply wouldn’t work:
https://taxpolicy.org.uk/2025/07/22/uk-wealth-tax-anti-growth/
That's very different to say someone who has £35m of gold, that value per troy ounce is set and you could sell some to pay the 2%, you can't really sell a bit of a private company to pay a wealth tax.
I don't imagine a wealth tax will be introduced in this country in the short term, although it's not like in the past the government are against doing stupid things!Retirement in Cyprus is looking ever more appealing!0 -
Depends on the definition of better, certainly easier to see someone with minor ailments, the few times I or family have been unwell out there the chemist usually prescribes something but never had anything major to be fair so don't know about operations and the like. I've given up with NHS GP's in this country, my wife this week tried to see a GP as injured her hand at school on Friday, finally got through today and has been offered an appointment on the 7th August and told if more urgent go to A&E.LargeAddick said:
As well as better weather you’d get better healthcare too from what our friends there tell us.Rob7Lee said:
Good article, I always look at these things predominantly with what I know personally or have first hand experience in, I know people who own companies that would fall into this type of wealth tax. One (of many!) of the difficulties I have is 1. how do you value a private company? and 2. Just because someone has a company worth say £35m (however that is derived) doesn't mean the company has £500,000 PER ANNUM to pay a 2% tax above £10m.Diebythesword said:Excellent analysis of why a wealth tax simply wouldn’t work:
https://taxpolicy.org.uk/2025/07/22/uk-wealth-tax-anti-growth/
That's very different to say someone who has £35m of gold, that value per troy ounce is set and you could sell some to pay the 2%, you can't really sell a bit of a private company to pay a wealth tax.
I don't imagine a wealth tax will be introduced in this country in the short term, although it's not like in the past the government are against doing stupid things!Retirement in Cyprus is looking ever more appealing!
Jokes aside I think it's certainly more considered now than 20 years ago, one of my friends recently moved/retired early to the IoM and is becoming a resident/tax resident, not solely for tax reasons but it was certainly a contributing factor. A maximum 21% tax rate (there's an allowance and a 10% rate) and no IHT. I think there's an overall tax cap as well, but not sure what that is, he mentioned something about it being over a 5 year period that he was applying for. Not sure I could live in the IoM though!1 -
Sponsored links:
-
But that Gary bloke told me the wealth tax was the answer to all our problems, he’s got a working class accent and he’s good at maths!Rob7Lee said:
Good article, I always look at these things predominantly with what I know personally or have first hand experience in, I know people who own companies that would fall into this type of wealth tax. One (of many!) of the difficulties I have is 1. how do you value a private company? and 2. Just because someone has a company worth say £35m (however that is derived) doesn't mean the company has £500,000 PER ANNUM to pay a 2% tax above £10m.Diebythesword said:Excellent analysis of why a wealth tax simply wouldn’t work:
https://taxpolicy.org.uk/2025/07/22/uk-wealth-tax-anti-growth/
That's very different to say someone who has £35m of gold, that value per troy ounce is set and you could sell some to pay the 2%, you can't really sell a bit of a private company to pay a wealth tax.
I don't imagine a wealth tax will be introduced in this country in the short term, although it's not like in the past the government are against doing stupid things!Retirement in Cyprus is looking ever more appealing!6 -
Total number of days lost to strike action under the Tories in both 2022 and 2023 = 2.5M whereas that figure is now down to 50,000 per month under LabourSantaClaus said:golfaddick said:
There has been a spike in inflation this year partly driven by the train drivers & doctors getting big pay rises as soon as Labour came in last July.Carter said:
I don't think that argument about low paid workers being paid an actual living wage causing inflation is without merit. What it means in reality though is some people will pull in a bit less money but a lot of people all of a sudden might have some more to spend on stuff that stimulates economies, holidays, cars, clothes, computers.cantersaddick said:
Which is what we are told will happen. But we've had ridiculous levels of inflation at the same time as wage suppression so many times in the last 50 years. The wage price spiral is a theory that gets wheeled out every time working people want higher wages but has literally never been bourne out in empirical evidence.golfaddick said:
Unfortunately that would lead to higher inflation, which would lead to higher interest rates, which would mean higher mortgage payments.....and for those that rent (which are a lot of the lower paid) will mean higher rents as landlords who have BTL mortgages increase the rent.Diebythesword said:
Sure, and the answer to that is to try and get them to a point where they are being paid more for what they do. That’s (provably, as it’s currently the case) not done by suppressing the wages of everyone else.hoof_it_up_to_benty said:
I think a lot of people would think it was a lot. There are plenty of people doing valuable jobs who get paid peanuts because society doesn't value their roles - they'd love to get a decent wage.Diebythesword said:
The point is it’s no longer a “privileged group”. £100k a year in London isn’t a lot. You can have highly specialised relatively junior roles popping into £100k territory. I want people to earn as much as they can so the tax man can take as much as they can without hurting productivity. The 65% tax trap doesn’t do either.hoof_it_up_to_benty said:
First World problem. Privileged group moaning about their lot and expecting sympathy.Huskaris said:First read about "Henry's" in a great article in The Economist, Standard have done a good article below. I find this area and this group of people fascinating.
https://www.standard.co.uk/lifestyle/henrys-high-earners-not-rich-yet-london-struggling-b1238642.html
If this is the biggest problem in your life you don't have too much to worry about.
No easy answer I'm afraid. Average income is around £32k pa so anyone affected by the reduction in the PA is earning 3x the average.
And it will get worse. Taxes need to rise. No idea where Rachel Reeves will go to next but I suspect it wont be from the low paid.
I'll say it again if average wages increased with purchasing power since 1980 it would be £85k. If the higher rate of income tax threshold had risen with inflation it would be £162k. We have a low pay problem in the UK.
It's not an arguement its fact.
That was an interesting juncture. Sterling fell immediately after those payouts and the governments borrowing costs rose. I don't think Reeves or the government have ever really recovered from that smack of fiscal reality.
GDP growth 2019-24 under the Tories 3% or 0.6% PA... mid August will see the ONS release for June / Q2 2025 which is likely to show growth under Labour at around 1.2% - that's double the last Gov't.
BoE base rate was 5.25% but now 4.25% and tipped to come down twice more this year. That impacts mortgage holders, Gov't debt costs and the business environment.
Pay rises at 5% have outstripped inflation leading to more household income, a higher tax take and perhaps a reduction in benefits? Certainly the increase in the minimum wage should be felt on the high street.
It's incredibly hard to discern what happens next but one outcome is that this Labour Gov't trades through the various headwinds as rates come down, GDP growth continues AND increased tax receipts associated with both growth and freezing various allowances.
With such a massive majority in Parliament, one would hope for a far bigger impact on NHS waiting lists, failing water companies, electricity generation and planning etc. Time will tell whether the various deals with India, Europe etc and various ideas will make a tangible difference over the next year. We should at least hope that the BoE end quantitative tightening and perhaps even consider QE later in this cycle because our country needs massive investment in infrastructure, health and education, not to mention the housing stock.
Therefore the Gov't should be able to afford the latest NATO commitments, not least because billions spent on housing asylum seekers under the last government is rapidly reducing with far more asylum cases processed as well as rejected appelants being deported.
1 -
Don't make the mistake in believing the people who are pro a wealth tax believe it is easy to achieve.Diebythesword said:
But that Gary bloke told me the wealth tax was the answer to all our problems, he’s got a working class accent and he’s good at maths!Rob7Lee said:
Good article, I always look at these things predominantly with what I know personally or have first hand experience in, I know people who own companies that would fall into this type of wealth tax. One (of many!) of the difficulties I have is 1. how do you value a private company? and 2. Just because someone has a company worth say £35m (however that is derived) doesn't mean the company has £500,000 PER ANNUM to pay a 2% tax above £10m.Diebythesword said:Excellent analysis of why a wealth tax simply wouldn’t work:
https://taxpolicy.org.uk/2025/07/22/uk-wealth-tax-anti-growth/
That's very different to say someone who has £35m of gold, that value per troy ounce is set and you could sell some to pay the 2%, you can't really sell a bit of a private company to pay a wealth tax.
I don't imagine a wealth tax will be introduced in this country in the short term, although it's not like in the past the government are against doing stupid things!Retirement in Cyprus is looking ever more appealing!4 -
If a tax isn’t easy to achieve and it has limited take. Is it really worth doing at all?Friend Or Defoe said:
Don't make the mistake in believing the people who are pro a wealth tax believe it is easy to achieve.Diebythesword said:
But that Gary bloke told me the wealth tax was the answer to all our problems, he’s got a working class accent and he’s good at maths!Rob7Lee said:
Good article, I always look at these things predominantly with what I know personally or have first hand experience in, I know people who own companies that would fall into this type of wealth tax. One (of many!) of the difficulties I have is 1. how do you value a private company? and 2. Just because someone has a company worth say £35m (however that is derived) doesn't mean the company has £500,000 PER ANNUM to pay a 2% tax above £10m.Diebythesword said:Excellent analysis of why a wealth tax simply wouldn’t work:
https://taxpolicy.org.uk/2025/07/22/uk-wealth-tax-anti-growth/
That's very different to say someone who has £35m of gold, that value per troy ounce is set and you could sell some to pay the 2%, you can't really sell a bit of a private company to pay a wealth tax.
I don't imagine a wealth tax will be introduced in this country in the short term, although it's not like in the past the government are against doing stupid things!Retirement in Cyprus is looking ever more appealing!0 -
What?Diebythesword said:
If a tax isn’t easy to achieve and it has limited take. Is it really worth doing at all?Friend Or Defoe said:
Don't make the mistake in believing the people who are pro a wealth tax believe it is easy to achieve.Diebythesword said:
But that Gary bloke told me the wealth tax was the answer to all our problems, he’s got a working class accent and he’s good at maths!Rob7Lee said:
Good article, I always look at these things predominantly with what I know personally or have first hand experience in, I know people who own companies that would fall into this type of wealth tax. One (of many!) of the difficulties I have is 1. how do you value a private company? and 2. Just because someone has a company worth say £35m (however that is derived) doesn't mean the company has £500,000 PER ANNUM to pay a 2% tax above £10m.Diebythesword said:Excellent analysis of why a wealth tax simply wouldn’t work:
https://taxpolicy.org.uk/2025/07/22/uk-wealth-tax-anti-growth/
That's very different to say someone who has £35m of gold, that value per troy ounce is set and you could sell some to pay the 2%, you can't really sell a bit of a private company to pay a wealth tax.
I don't imagine a wealth tax will be introduced in this country in the short term, although it's not like in the past the government are against doing stupid things!Retirement in Cyprus is looking ever more appealing!0 -
There would be a danger of turning this into a political thread which everybody wants to avoid. However this can't be let go. If you really believe some of the comments and implications in this, then I am very disapointed and thought you had a higher level of grasp. If you wish to take this debate further you can pm me.seriously_red said:
Total number of days lost to strike action under the Tories in both 2022 and 2023 = 2.5M whereas that figure is now down to 50,000 per month under LabourSantaClaus said:golfaddick said:
There has been a spike in inflation this year partly driven by the train drivers & doctors getting big pay rises as soon as Labour came in last July.Carter said:
I don't think that argument about low paid workers being paid an actual living wage causing inflation is without merit. What it means in reality though is some people will pull in a bit less money but a lot of people all of a sudden might have some more to spend on stuff that stimulates economies, holidays, cars, clothes, computers.cantersaddick said:
Which is what we are told will happen. But we've had ridiculous levels of inflation at the same time as wage suppression so many times in the last 50 years. The wage price spiral is a theory that gets wheeled out every time working people want higher wages but has literally never been bourne out in empirical evidence.golfaddick said:
Unfortunately that would lead to higher inflation, which would lead to higher interest rates, which would mean higher mortgage payments.....and for those that rent (which are a lot of the lower paid) will mean higher rents as landlords who have BTL mortgages increase the rent.Diebythesword said:
Sure, and the answer to that is to try and get them to a point where they are being paid more for what they do. That’s (provably, as it’s currently the case) not done by suppressing the wages of everyone else.hoof_it_up_to_benty said:
I think a lot of people would think it was a lot. There are plenty of people doing valuable jobs who get paid peanuts because society doesn't value their roles - they'd love to get a decent wage.Diebythesword said:
The point is it’s no longer a “privileged group”. £100k a year in London isn’t a lot. You can have highly specialised relatively junior roles popping into £100k territory. I want people to earn as much as they can so the tax man can take as much as they can without hurting productivity. The 65% tax trap doesn’t do either.hoof_it_up_to_benty said:
First World problem. Privileged group moaning about their lot and expecting sympathy.Huskaris said:First read about "Henry's" in a great article in The Economist, Standard have done a good article below. I find this area and this group of people fascinating.
https://www.standard.co.uk/lifestyle/henrys-high-earners-not-rich-yet-london-struggling-b1238642.html
If this is the biggest problem in your life you don't have too much to worry about.
No easy answer I'm afraid. Average income is around £32k pa so anyone affected by the reduction in the PA is earning 3x the average.
And it will get worse. Taxes need to rise. No idea where Rachel Reeves will go to next but I suspect it wont be from the low paid.
I'll say it again if average wages increased with purchasing power since 1980 it would be £85k. If the higher rate of income tax threshold had risen with inflation it would be £162k. We have a low pay problem in the UK.
It's not an arguement its fact.
That was an interesting juncture. Sterling fell immediately after those payouts and the governments borrowing costs rose. I don't think Reeves or the government have ever really recovered from that smack of fiscal reality.
GDP growth 2019-24 under the Tories 3% or 0.6% PA... mid August will see the ONS release for June / Q2 2025 which is likely to show growth under Labour at around 1.2% - that's double the last Gov't.
BoE base rate was 5.25% but now 4.25% and tipped to come down twice more this year. That impacts mortgage holders, Gov't debt costs and the business environment.
Pay rises at 5% have outstripped inflation leading to more household income, a higher tax take and perhaps a reduction in benefits? Certainly the increase in the minimum wage should be felt on the high street.
It's incredibly hard to discern what happens next but one outcome is that this Labour Gov't trades through the various headwinds as rates come down, GDP growth continues AND increased tax receipts associated with both growth and freezing various allowances.
With such a massive majority in Parliament, one would hope for a far bigger impact on NHS waiting lists, failing water companies, electricity generation and planning etc. Time will tell whether the various deals with India, Europe etc and various ideas will make a tangible difference over the next year. We should at least hope that the BoE end quantitative tightening and perhaps even consider QE later in this cycle because our country needs massive investment in infrastructure, health and education, not to mention the housing stock.
Therefore the Gov't should be able to afford the latest NATO commitments, not least because billions spent on housing asylum seekers under the last government is rapidly reducing with far more asylum cases processed as well as rejected appelants being deported.6 -
To relieve the tension on here I'll put in my guess for the FTSE100 at the end of December........
91011 -
88841
-
golfaddick said:To relieve the tension on here I'll put in my guess for the FTSE100 at the end of December........
9101
The one we've been waiting for") obviously rates wishidstayedinthepub who chose the same! 4
obviously rates wishidstayedinthepub who chose the same! 4 -
Have we found the model or definitions/explanations yet that shows today's UK average salary should be 85k and not 26k? Asking for a friend.2
-
Sponsored links:
-
Rob7Lee said:Have we found the model or definitions/explanations yet that shows today's UK average salary should be 85k and not 26k? Asking for a friend.As we could see, the figures initially quoted by Canters seemed to align with the simple house price inflation extrapolation. It must have been coincidence as Canters said his model was multi faceted so it would be very interesting to see how the £85k figure is arrived at. I seriously question it though.Consumer Price Inflation since 2017 has included the three main indices, CPI, CPIH (includes owner occupier inflation) and RPI. An estimate of inflation since 1980 to 2025 makes £100 then worth £548 now in terms of buying power. Extrapolate a £6,000 average salary in 1980 to now would equal an average salary in 2025 of £32,880 to stand still - so higher than your £26k, probably because it does include mortgages, but much lower than the claimed £85k. For reference average wages in the UK in 2025 are £722 pw (£37.5K) which is above the £32,880 figure. However that includes bonuses/overtime - the average basic salary in the UK is £30k, less than the extrapolated figure of £32,880. What I don't know is whether or not the £6,000 in 1980 was basic earnings or total earnings.Either way - the £85k is likely to be a work of fiction.5
-
Didn't even look at the other guesses. I simply went with sequential numbering. 9....10....1(1).Rob7Lee said:golfaddick said:To relieve the tension on here I'll put in my guess for the FTSE100 at the end of December........
9101
The one we've been waiting for obviously rates wishidstayedinthepub who chose the same!
Good enough reason than any other.2 -
Don’t share it with the junior doctors. Their demands will rise even more !bobmunro said:Rob7Lee said:Have we found the model or definitions/explanations yet that shows today's UK average salary should be 85k and not 26k? Asking for a friend.As we could see, the figures initially quoted by Canters seemed to align with the simple house price inflation extrapolation. It must have been coincidence as Canters said his model was multi faceted so it would be very interesting to see how the £85k figure is arrived at. I seriously question it though.Consumer Price Inflation since 2017 has included the three main indices, CPI, CPIH (includes owner occupier inflation) and RPI. An estimate of inflation since 1980 to 2025 makes £100 then worth £548 now in terms of buying power. Extrapolate a £6,000 average salary in 1980 to now would equal an average salary in 2025 of £32,880 to stand still - so higher than your £26k, probably because it does include mortgages, but much lower than the claimed £85k. For reference average wages in the UK in 2025 are £722 pw (£37.5K) which is above the £32,880 figure. However that includes bonuses/overtime - the average basic salary in the UK is £30k, less than the extrapolated figure of £32,880. What I don't know is whether or not the £6,000 in 1980 was basic earnings or total earnings.Either way - the £85k is likely to be a work of fiction.4 -
It's funny because the last Government had to change pension rules & scrap the LTA because Hospital Consultants had too much in their pensions they were leaving before they were 60.valleynick66 said:
Don’t share it with the junior doctors. Their demands will rise even more !bobmunro said:Rob7Lee said:Have we found the model or definitions/explanations yet that shows today's UK average salary should be 85k and not 26k? Asking for a friend.As we could see, the figures initially quoted by Canters seemed to align with the simple house price inflation extrapolation. It must have been coincidence as Canters said his model was multi faceted so it would be very interesting to see how the £85k figure is arrived at. I seriously question it though.Consumer Price Inflation since 2017 has included the three main indices, CPI, CPIH (includes owner occupier inflation) and RPI. An estimate of inflation since 1980 to 2025 makes £100 then worth £548 now in terms of buying power. Extrapolate a £6,000 average salary in 1980 to now would equal an average salary in 2025 of £32,880 to stand still - so higher than your £26k, probably because it does include mortgages, but much lower than the claimed £85k. For reference average wages in the UK in 2025 are £722 pw (£37.5K) which is above the £32,880 figure. However that includes bonuses/overtime - the average basic salary in the UK is £30k, less than the extrapolated figure of £32,880. What I don't know is whether or not the £6,000 in 1980 was basic earnings or total earnings.Either way - the £85k is likely to be a work of fiction.
Doctors are never happy. 25-30 year olds striking because they dont get paid enough but then wind on 30 years and their 55-60 year old colleagues are leaving in droves because they are getting taxed too much.3 -
Well on their salaries I'm guessing the line is that we shouldn't have sympathy for them because they're on a good wage and they can piss off, right?!golfaddick said:
It's funny because the last Government had to change pension rules & scrap the LTA because Hospital Consultants had too much in their pensions they were leaving before they were 60.valleynick66 said:
Don’t share it with the junior doctors. Their demands will rise even more !bobmunro said:Rob7Lee said:Have we found the model or definitions/explanations yet that shows today's UK average salary should be 85k and not 26k? Asking for a friend.As we could see, the figures initially quoted by Canters seemed to align with the simple house price inflation extrapolation. It must have been coincidence as Canters said his model was multi faceted so it would be very interesting to see how the £85k figure is arrived at. I seriously question it though.Consumer Price Inflation since 2017 has included the three main indices, CPI, CPIH (includes owner occupier inflation) and RPI. An estimate of inflation since 1980 to 2025 makes £100 then worth £548 now in terms of buying power. Extrapolate a £6,000 average salary in 1980 to now would equal an average salary in 2025 of £32,880 to stand still - so higher than your £26k, probably because it does include mortgages, but much lower than the claimed £85k. For reference average wages in the UK in 2025 are £722 pw (£37.5K) which is above the £32,880 figure. However that includes bonuses/overtime - the average basic salary in the UK is £30k, less than the extrapolated figure of £32,880. What I don't know is whether or not the £6,000 in 1980 was basic earnings or total earnings.Either way - the £85k is likely to be a work of fiction.
Doctors are never happy. 25-30 year olds striking because they dont get paid enough but then wind on 30 years and their 55-60 year old colleagues are leaving in droves because they are getting taxed too much.0 -
Busy day in the office, back to back all day.
Okay this is a little long - tried to do a spoiler thing for the lower section but couldn't get it to work. If anyone knows how to please shout.
So some definitions below. These were written by a former head of my team (left before I joined) who is now a professor in the US (hence some $ and some half and half Americanisms). He's written an entire academic style paper on these and why CPI is rarely the correct measure but thats wayyy too long to paste here.
I have stripped out the sector specific bits of the model and adjusted the starting point baseline to match the £6k discussed here.
The results for end FY 2025 (projected) under the 3 non-CPI relevant metrics are:labour earnings £52,520.00
relative income £58,900.00
relative output £72,380.00Not quite £85k because of the actions I mentioned above but still show how far away the £19k CPI adjustment is from reality. Its a judgement call what is the right measure. As said before CPI adjustments being the most commonly used does not in any way make it the best measure to use.
*If anyone knows how to do the spoiler thing I can do it to the below*
__________________________________________________________________________
If you want to compare the value of a Commodity over time there are four choices. The relative:
real price of that commodity: Real Price is measured as value of a commodity relative to the value of a (fixed over time) bundle of goods and services such as food, shelter, clothing, etc. (e.g., the CPI), that an average household would buy. In theory the size of this bundle does not change over time, but in practice adjustments are made to its composition. Using the CPI, the real cost of a commodity in 2021 in 2000-year prices would be its current price times (172.2/270.97) or 64% of the current price. The real price of a commodity in 2000 measured in 2021 prices would be a multiple of the inverse (270.97/172.2) or 157.4%.
labour value of that commodity: This measures the value of a commodity in relation to the average wage that a worker would need to use to buy the commodity. This measure uses one of the wage indexes (e.g., the wage rate or the earnings of unskilled labor). This measure gives the value of a loaf of bread in terms of the number of paid labor hours required to purchase it. In 2021 the average hourly wage of a food and beverage worker was $12.49 per hour. Thus for such a worker to purchase a $1.52 loaf of bread, it took (or had a labor value of) about eight minutes of labor.
income value of that commodity: Sometimes it is preferred to measure the value of a commodity in terms of an income measure (e.g., the average income of doctors or per-capita GDP). This measure is called the income value of the commodity. In 2021 and a new Chevy Cruze was $23,700 and the GDP per capita is $69,288. Thus, the income value of this car is about 34% of per-capita annual income. Similarly, the income value of a Rolls Royce SUV is 476%.
economic share of that commodity: Economic Share – This is the worth of a commodity divided by GDP; its share of total output. This is helpful in measuring the relative value of aggregate consumption items such as all the cars made in a year. In 2021 there were almost 9.2 million cars and trucks produced in the US. In the national income accounts, it is reported that the production of motor vehicles and parts was $595.5 billion out of a GDP of over $23 trillion. So, the economic share of cars and trucks was 2.6%. For comparison, the $74 billion output of bread products was a mere .32% of the output of the economy.
If you want to compare the value of Income or Wealth , over time there are four choices. The relative:
real wage or real wealth value of that income or wealth: The real wage measures the purchasing power of an income (be that an hourly wage, yearly salary, or an end of year bonus) by its relative ability to buy a (fixed over time) bundle of goods and services such as food, shelter, clothing, etc. (e.g., the CPI). In most cases, the real wage is constructed using the CPI index. The idea is that recipient of this compensation is going to spend it on items in the household bundle, so the real wage has now been converted the purchasing power of a fixed bundle of consumer goods. (Real wealth is measured the same way, but it is a stock as compared to a flow. A person can have the same nominal wealth year after year, but his or her real wealth will change.
labour earnings of that income or wealth: This measures an amount of income relative to the average income or wage of the average worker. For labour earnings this is divided by an index of wages or salaries.
relative income value of that income or wealth: This measures an amount of income or wealth relative to the average income or wage of the average worker. If one’s wealth is used as the numerator, the ratio becomes Relative Wealth. For relative income this is divided by the annual GDP per-capita, the result provides an indication of their relative status in the economy.
relative output value of that income or wealth: The ratio of income, compensation or wealth to GDP provides a sense of the share of the economy it represents, the amount of what we call the relative output it commands.
If you want to compare the value of a Project over time there are three choices. The relative:
real cost of that project: This is the cost of a project measured by comparing its cost to an index of prices for all output in the economy (e.g., the GDP Deflator). Sometimes using the CPI makes sense. If the parishioners are wondering how much those donations of $1,000 each made to build a new church 16 years ago “are worth today,” using the CPI, they would conclude it was $1,420. For larger projects, it usually makes more sense to use the GDP deflator.
labour cost of that project: This is defined as a project’s cost relative to the average wage of the workers who might have been/be used to build the project. As an example, consider that the Erie Canal that was constructed mostly with unskilled labor. The ratio of its cost to the unskilled wage is a good measure of its opportunity cost in terms of what else might have been built. Of course the cost of labor is only part (though often the largest) of the total cost. Using the per-capita GDP mitigates some of this problem.
economic cost of that project: This is measured as the cost of a large project or expenditure (e.g., large-scale investments, government deficits, or wars) as a percent of the output of the economy. This measure indicates the opportunity cost of the project as the share of the total output of the economy (GDP). It can be interpreted as the importance of the item to society as a whole. It is termed the Economy Cost (in contrast to the Household Cost which is the result of dividing by the AHE). For these larger output items, calculating the share of GDP is often the measure of choice because it focuses on the opportunity cost; the resources that produced the output in question in relation to the total output of the economy.4 -
I think what the above shows is not what you need to earn to be able to buy the same basket of goods, but focuses on a deteriorating value of labour and an increasing value of capital expenditure (eg machinery).cantersaddick said:Busy day in the office, back to back all day.
Okay this is a little long - tried to do a spoiler thing for the lower section but couldn't get it to work. If anyone knows how to please shout.
So some definitions below. These were written by a former head of my team (left before I joined) who is now a professor in the US (hence some $ and some half and half Americanisms). He's written an entire academic style paper on these and why CPI is rarely the correct measure but thats wayyy too long to paste here.
I have stripped out the sector specific bits of the model and adjusted the starting point baseline to match the £6k discussed here.
The results for end FY 2025 (projected) under the 3 non-CPI relevant metrics are:labour earnings £52,520.00
relative income £58,900.00
relative output £72,380.00Not quite £85k because of the actions I mentioned above but still show how far away the £19k CPI adjustment is from reality. Its a judgement call what is the right measure. As said before CPI adjustments being the most commonly used does not in any way make it the best measure to use.
*If anyone knows how to do the spoiler thing I can do it to the below*
__________________________________________________________________________
If you want to compare the value of a Commodity over time there are four choices. The relative:
real price of that commodity: Real Price is measured as value of a commodity relative to the value of a (fixed over time) bundle of goods and services such as food, shelter, clothing, etc. (e.g., the CPI), that an average household would buy. In theory the size of this bundle does not change over time, but in practice adjustments are made to its composition. Using the CPI, the real cost of a commodity in 2021 in 2000-year prices would be its current price times (172.2/270.97) or 64% of the current price. The real price of a commodity in 2000 measured in 2021 prices would be a multiple of the inverse (270.97/172.2) or 157.4%.
labour value of that commodity: This measures the value of a commodity in relation to the average wage that a worker would need to use to buy the commodity. This measure uses one of the wage indexes (e.g., the wage rate or the earnings of unskilled labor). This measure gives the value of a loaf of bread in terms of the number of paid labor hours required to purchase it. In 2021 the average hourly wage of a food and beverage worker was $12.49 per hour. Thus for such a worker to purchase a $1.52 loaf of bread, it took (or had a labor value of) about eight minutes of labor.
income value of that commodity: Sometimes it is preferred to measure the value of a commodity in terms of an income measure (e.g., the average income of doctors or per-capita GDP). This measure is called the income value of the commodity. In 2021 and a new Chevy Cruze was $23,700 and the GDP per capita is $69,288. Thus, the income value of this car is about 34% of per-capita annual income. Similarly, the income value of a Rolls Royce SUV is 476%.
economic share of that commodity: Economic Share – This is the worth of a commodity divided by GDP; its share of total output. This is helpful in measuring the relative value of aggregate consumption items such as all the cars made in a year. In 2021 there were almost 9.2 million cars and trucks produced in the US. In the national income accounts, it is reported that the production of motor vehicles and parts was $595.5 billion out of a GDP of over $23 trillion. So, the economic share of cars and trucks was 2.6%. For comparison, the $74 billion output of bread products was a mere .32% of the output of the economy.
If you want to compare the value of Income or Wealth , over time there are four choices. The relative:
real wage or real wealth value of that income or wealth: The real wage measures the purchasing power of an income (be that an hourly wage, yearly salary, or an end of year bonus) by its relative ability to buy a (fixed over time) bundle of goods and services such as food, shelter, clothing, etc. (e.g., the CPI). In most cases, the real wage is constructed using the CPI index. The idea is that recipient of this compensation is going to spend it on items in the household bundle, so the real wage has now been converted the purchasing power of a fixed bundle of consumer goods. (Real wealth is measured the same way, but it is a stock as compared to a flow. A person can have the same nominal wealth year after year, but his or her real wealth will change.
labour earnings of that income or wealth: This measures an amount of income relative to the average income or wage of the average worker. For labour earnings this is divided by an index of wages or salaries.
relative income value of that income or wealth: This measures an amount of income or wealth relative to the average income or wage of the average worker. If one’s wealth is used as the numerator, the ratio becomes Relative Wealth. For relative income this is divided by the annual GDP per-capita, the result provides an indication of their relative status in the economy.
relative output value of that income or wealth: The ratio of income, compensation or wealth to GDP provides a sense of the share of the economy it represents, the amount of what we call the relative output it commands.
If you want to compare the value of a Project over time there are three choices. The relative:
real cost of that project: This is the cost of a project measured by comparing its cost to an index of prices for all output in the economy (e.g., the GDP Deflator). Sometimes using the CPI makes sense. If the parishioners are wondering how much those donations of $1,000 each made to build a new church 16 years ago “are worth today,” using the CPI, they would conclude it was $1,420. For larger projects, it usually makes more sense to use the GDP deflator.
labour cost of that project: This is defined as a project’s cost relative to the average wage of the workers who might have been/be used to build the project. As an example, consider that the Erie Canal that was constructed mostly with unskilled labor. The ratio of its cost to the unskilled wage is a good measure of its opportunity cost in terms of what else might have been built. Of course the cost of labor is only part (though often the largest) of the total cost. Using the per-capita GDP mitigates some of this problem.
economic cost of that project: This is measured as the cost of a large project or expenditure (e.g., large-scale investments, government deficits, or wars) as a percent of the output of the economy. This measure indicates the opportunity cost of the project as the share of the total output of the economy (GDP). It can be interpreted as the importance of the item to society as a whole. It is termed the Economy Cost (in contrast to the Household Cost which is the result of dividing by the AHE). For these larger output items, calculating the share of GDP is often the measure of choice because it focuses on the opportunity cost; the resources that produced the output in question in relation to the total output of the economy.
What the above shows (if I understand it properly) is (through various mechanisms) the rise in GDP per capita by person who is actually economically active vs CPI.
Labour is worth less, mechanism is worth more. That's been the case since Victorian times.
Definitely interesting by the way, thanks for posting1 -
None of the above is anything new (no offence but it's all a straight cut from Measuringworth website) and unless I'm totally misunderstanding (but think what Huskaris says confirms) has noting to do with you original statement that lead us here that 'I'll say it again if average wages increased with purchasing power since 1980 it would be £85k'cantersaddick said:Busy day in the office, back to back all day.
Okay this is a little long - tried to do a spoiler thing for the lower section but couldn't get it to work. If anyone knows how to please shout.
So some definitions below. These were written by a former head of my team (left before I joined) who is now a professor in the US (hence some $ and some half and half Americanisms). He's written an entire academic style paper on these and why CPI is rarely the correct measure but thats wayyy too long to paste here.
I have stripped out the sector specific bits of the model and adjusted the starting point baseline to match the £6k discussed here.
The results for end FY 2025 (projected) under the 3 non-CPI relevant metrics are:labour earnings £52,520.00
relative income £58,900.00
relative output £72,380.00Not quite £85k because of the actions I mentioned above but still show how far away the £19k CPI adjustment is from reality. Its a judgement call what is the right measure. As said before CPI adjustments being the most commonly used does not in any way make it the best measure to use.
*If anyone knows how to do the spoiler thing I can do it to the below*
__________________________________________________________________________
If you want to compare the value of a Commodity over time there are four choices. The relative:
real price of that commodity: Real Price is measured as value of a commodity relative to the value of a (fixed over time) bundle of goods and services such as food, shelter, clothing, etc. (e.g., the CPI), that an average household would buy. In theory the size of this bundle does not change over time, but in practice adjustments are made to its composition. Using the CPI, the real cost of a commodity in 2021 in 2000-year prices would be its current price times (172.2/270.97) or 64% of the current price. The real price of a commodity in 2000 measured in 2021 prices would be a multiple of the inverse (270.97/172.2) or 157.4%.
labour value of that commodity: This measures the value of a commodity in relation to the average wage that a worker would need to use to buy the commodity. This measure uses one of the wage indexes (e.g., the wage rate or the earnings of unskilled labor). This measure gives the value of a loaf of bread in terms of the number of paid labor hours required to purchase it. In 2021 the average hourly wage of a food and beverage worker was $12.49 per hour. Thus for such a worker to purchase a $1.52 loaf of bread, it took (or had a labor value of) about eight minutes of labor.
income value of that commodity: Sometimes it is preferred to measure the value of a commodity in terms of an income measure (e.g., the average income of doctors or per-capita GDP). This measure is called the income value of the commodity. In 2021 and a new Chevy Cruze was $23,700 and the GDP per capita is $69,288. Thus, the income value of this car is about 34% of per-capita annual income. Similarly, the income value of a Rolls Royce SUV is 476%.
economic share of that commodity: Economic Share – This is the worth of a commodity divided by GDP; its share of total output. This is helpful in measuring the relative value of aggregate consumption items such as all the cars made in a year. In 2021 there were almost 9.2 million cars and trucks produced in the US. In the national income accounts, it is reported that the production of motor vehicles and parts was $595.5 billion out of a GDP of over $23 trillion. So, the economic share of cars and trucks was 2.6%. For comparison, the $74 billion output of bread products was a mere .32% of the output of the economy.
If you want to compare the value of Income or Wealth , over time there are four choices. The relative:
real wage or real wealth value of that income or wealth: The real wage measures the purchasing power of an income (be that an hourly wage, yearly salary, or an end of year bonus) by its relative ability to buy a (fixed over time) bundle of goods and services such as food, shelter, clothing, etc. (e.g., the CPI). In most cases, the real wage is constructed using the CPI index. The idea is that recipient of this compensation is going to spend it on items in the household bundle, so the real wage has now been converted the purchasing power of a fixed bundle of consumer goods. (Real wealth is measured the same way, but it is a stock as compared to a flow. A person can have the same nominal wealth year after year, but his or her real wealth will change.
labour earnings of that income or wealth: This measures an amount of income relative to the average income or wage of the average worker. For labour earnings this is divided by an index of wages or salaries.
relative income value of that income or wealth: This measures an amount of income or wealth relative to the average income or wage of the average worker. If one’s wealth is used as the numerator, the ratio becomes Relative Wealth. For relative income this is divided by the annual GDP per-capita, the result provides an indication of their relative status in the economy.
relative output value of that income or wealth: The ratio of income, compensation or wealth to GDP provides a sense of the share of the economy it represents, the amount of what we call the relative output it commands.
If you want to compare the value of a Project over time there are three choices. The relative:
real cost of that project: This is the cost of a project measured by comparing its cost to an index of prices for all output in the economy (e.g., the GDP Deflator). Sometimes using the CPI makes sense. If the parishioners are wondering how much those donations of $1,000 each made to build a new church 16 years ago “are worth today,” using the CPI, they would conclude it was $1,420. For larger projects, it usually makes more sense to use the GDP deflator.
labour cost of that project: This is defined as a project’s cost relative to the average wage of the workers who might have been/be used to build the project. As an example, consider that the Erie Canal that was constructed mostly with unskilled labor. The ratio of its cost to the unskilled wage is a good measure of its opportunity cost in terms of what else might have been built. Of course the cost of labor is only part (though often the largest) of the total cost. Using the per-capita GDP mitigates some of this problem.
economic cost of that project: This is measured as the cost of a large project or expenditure (e.g., large-scale investments, government deficits, or wars) as a percent of the output of the economy. This measure indicates the opportunity cost of the project as the share of the total output of the economy (GDP). It can be interpreted as the importance of the item to society as a whole. It is termed the Economy Cost (in contrast to the Household Cost which is the result of dividing by the AHE). For these larger output items, calculating the share of GDP is often the measure of choice because it focuses on the opportunity cost; the resources that produced the output in question in relation to the total output of the economy.
Even using the calculator on their website (all be it US in dollar) $6,000 in 1980 is as below, 'purchasing power' is pretty much as I said, not quite your 85k, the nearest is wealth held or construction and even those are less than half.
If you actually click on the More will give you the detail I originally said (around CPI):
1 -
Yes the bloke I mentioned above who used to lead my team and is now a professor in the US is cited as pretty much every source on that website (no idea if he is involved with it or not). I think a version of his full paper I mentioned above is on there somewhere.
So yes of you use the CPI based measure you end up basically where you said CPI would get you. That's not my point. What I was trying to say is that CPI is that CPI isn't the best measure of looking at this. There are 3 other metrics for looking at the value of earnings alone. He and most academics argue these are better for this. All 3 are significantly higher. I'll accept I didn't explain or word this well in my original point.
Ohh and you can't use the US calculator for UK comparisons, it uses US metrics to feed everything.2 -
Welcome to the relegation zone, Golfiegolfaddick said:
Didn't even look at the other guesses. I simply went with sequential numbering. 9....10....1(1).Rob7Lee said:golfaddick said:To relieve the tension on here I'll put in my guess for the FTSE100 at the end of December........
9101
The one we've been waiting for obviously rates wishidstayedinthepub who chose the same!
Good enough reason than any other.1